Projects Overview
The Projects Overview provides an aggregated report of all open issues, baselined issues and code quality metrics across all your projects.
It includes issue distributions, time-based charts, and metric visualizations that help you identify problem areas, plan improvements, and track progress over time.
Applying Tags
To get an overview for a selected number of projects, use the tags filter:

Issues Overview
This section represents the latest state of all open issues across all your projects. Each issue category includes the following data:
- Issue count: Total number of open issues
- Estimated fix time: Calculated time to resolve all issues of this type
- Change percentage: Comparison with data from the previous 30 days
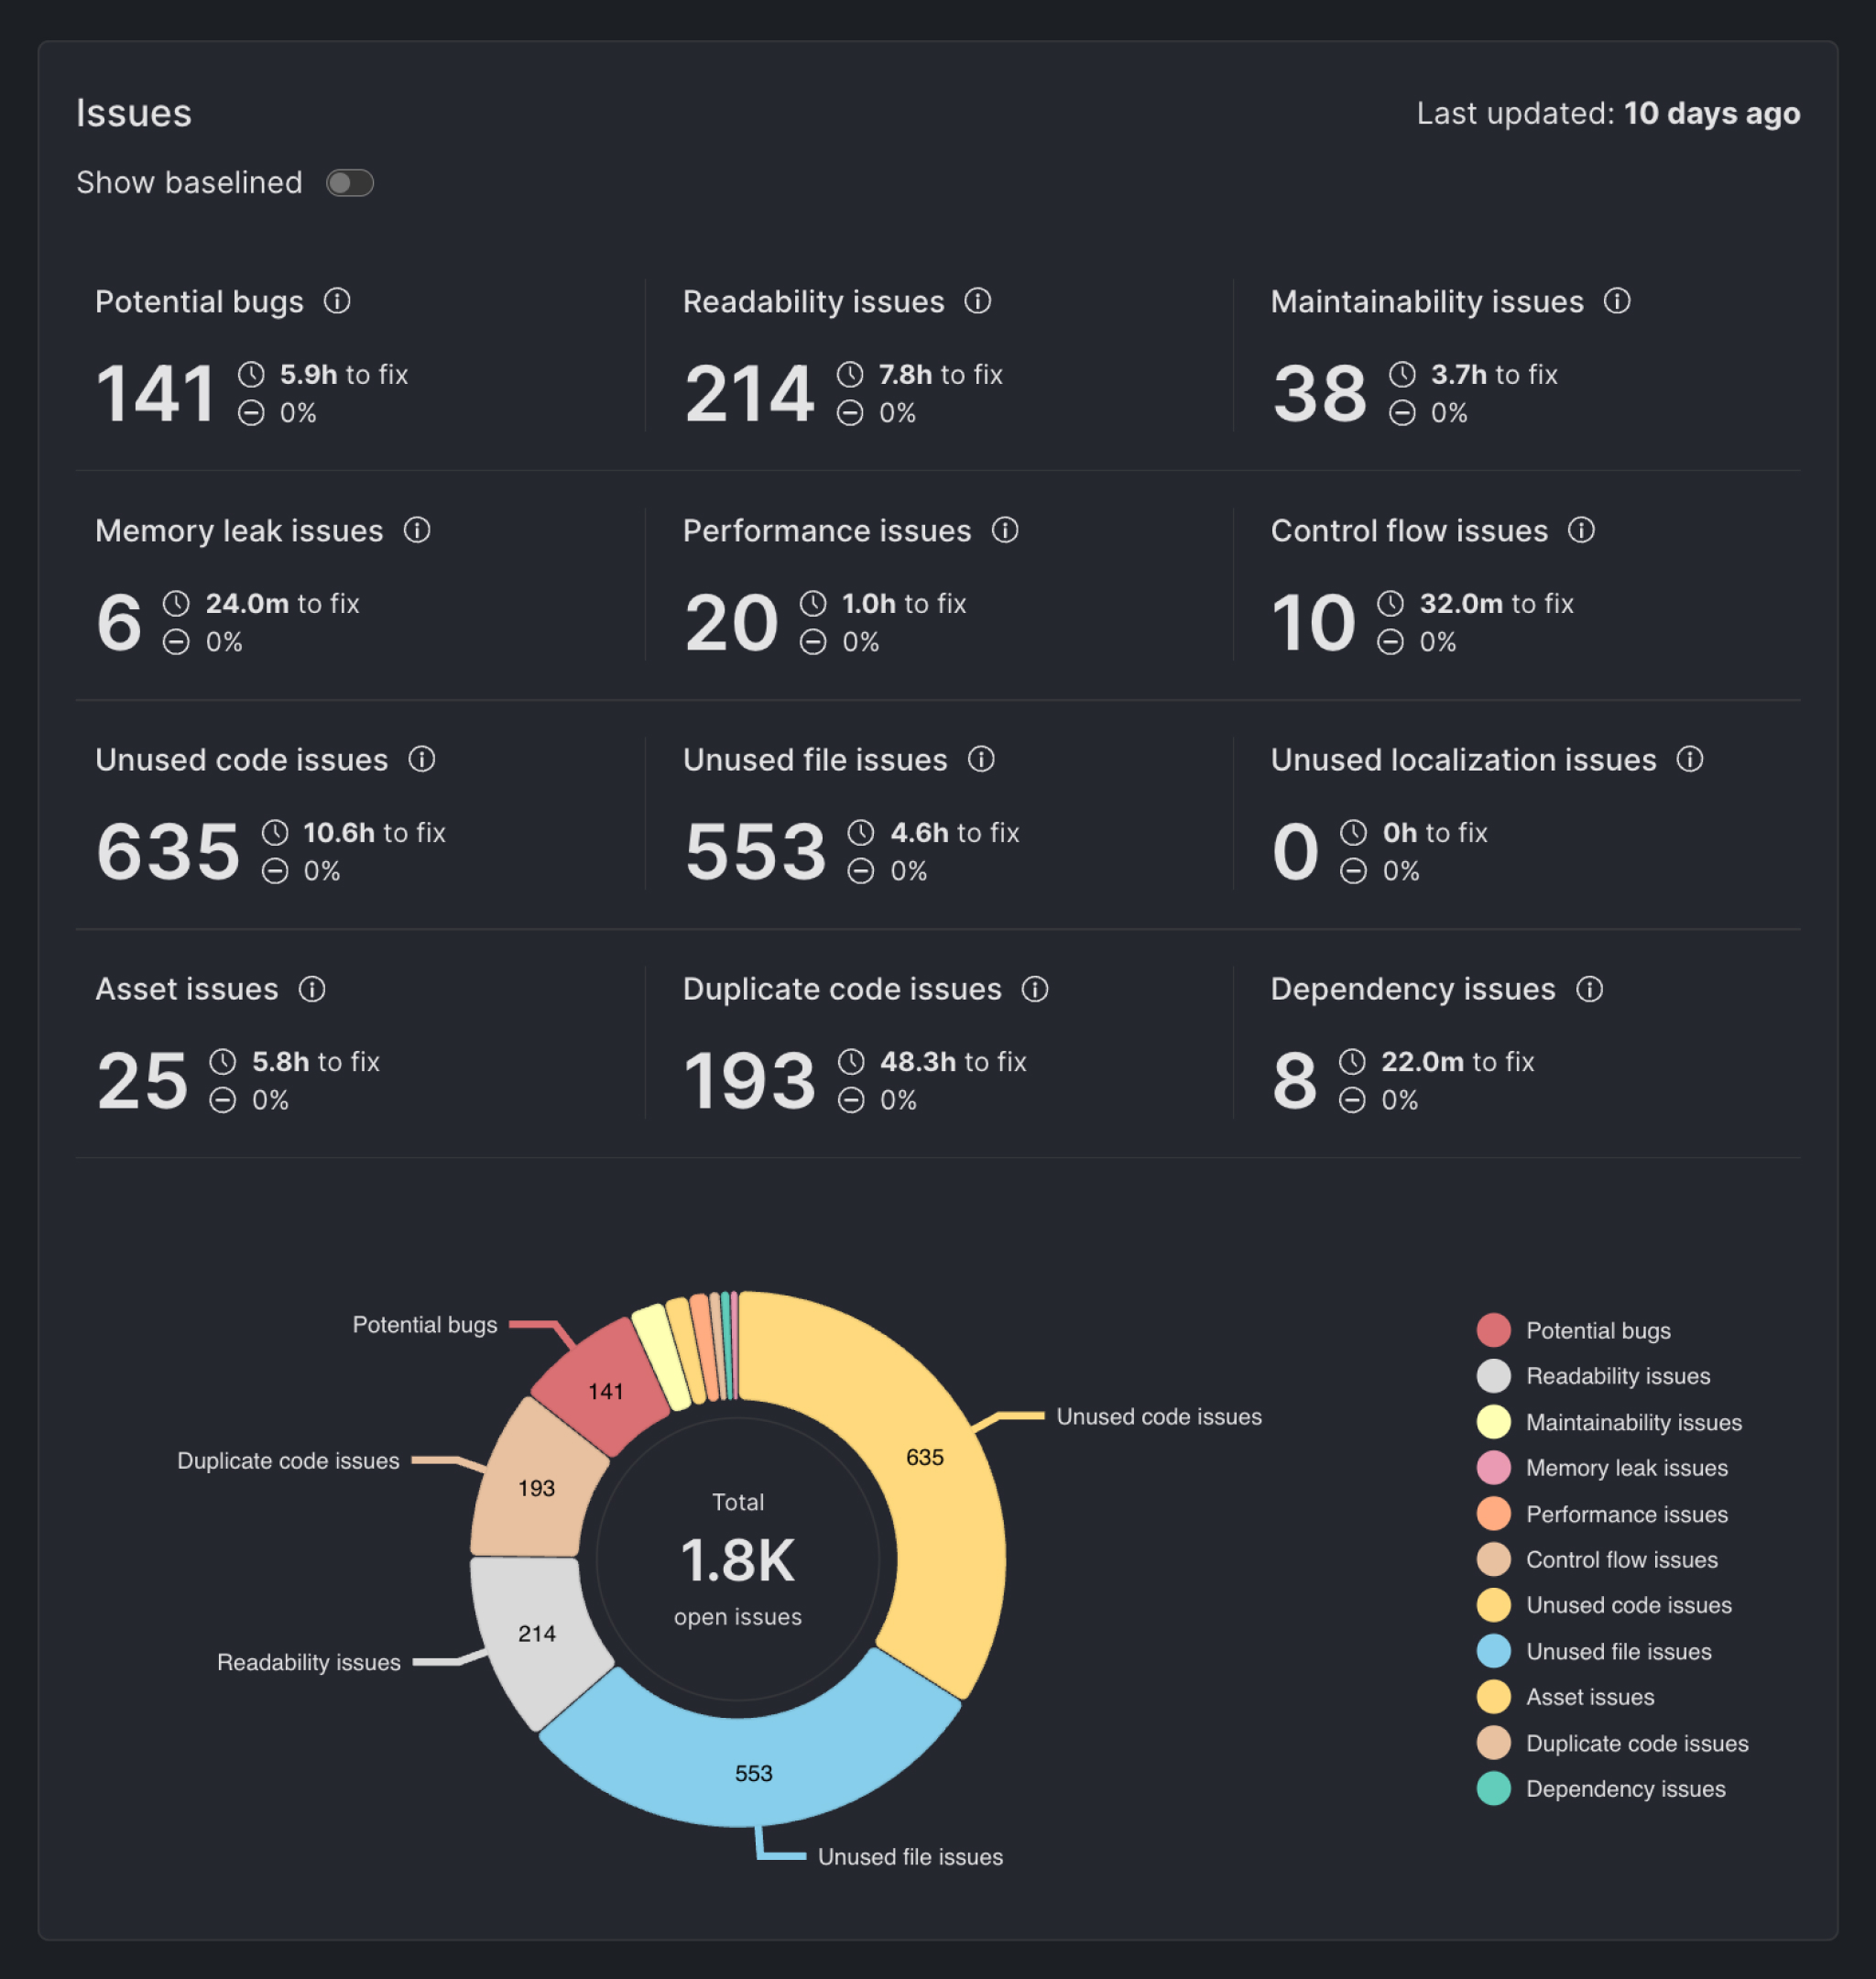
Toggle "Show baselined" to get an overview of the baselined issues.
Baselined issues overview will not have any data if the project does not have a baseline or the generated baseline has no issues.
To learn more about the baseline, refer to the Baseline documentation.
Issue Categories
Each issue category is mapped to either a DCM lint rule tag or a code quality command.
| Category | Description |
|---|---|
| Potential bugs | Issues that may lead to logic errors, runtime crashes, or unexpected behavior. From rules with correctness tag. |
| Readability issues | Issues that affect clarity or ease of understanding. From rules with readability tag. |
| Maintainability issues | Code that's harder to refactor or extend, like overly complex structures or poor modularity. From rules with maintainability tag. |
| Memory leak issues | Improper lifecycle handling, unclosed streams, or retained references. From rules with memory-leak tag. |
| Performance issues | Inefficient patterns that may degrade runtime performance. From rules with performance tag. |
| Control flow issues | Unoptimized or excessive branching, unreachable code, or redundant logic. From rules with control-flow tag. |
| Unused code issues | Functions, methods, fields, or classes that are defined but never used. From check-unused-code command. |
| Unused file issues | Project files that aren’t imported or referenced anywhere. From check-unused-files command. |
| Unused localization issues | Localization keys present in .arb files but not used in the app. From check-unused-l10n command. |
| Asset issues | Unoptimized, redundant or missing image assets. From analyze-assets command. |
| Duplicate code issues | Repeated blocks of code found across files. From check-code-duplication command. |
| Dependency issues | Unused, redundant, or outdated dependencies in the pubspec.yaml. From check-dependencies command. |
Open and Baselined Issues Over Time
This section shows how the number of open issues has changed over time and includes:
- Issue count: Total number of open issues
- Estimated fix time: Calculated time to resolve all issues
- Change percentage: Comparison with data from the previous 30 days
- A daily trend line over your selected time range (Last 7, 14, 30, or 90 days)
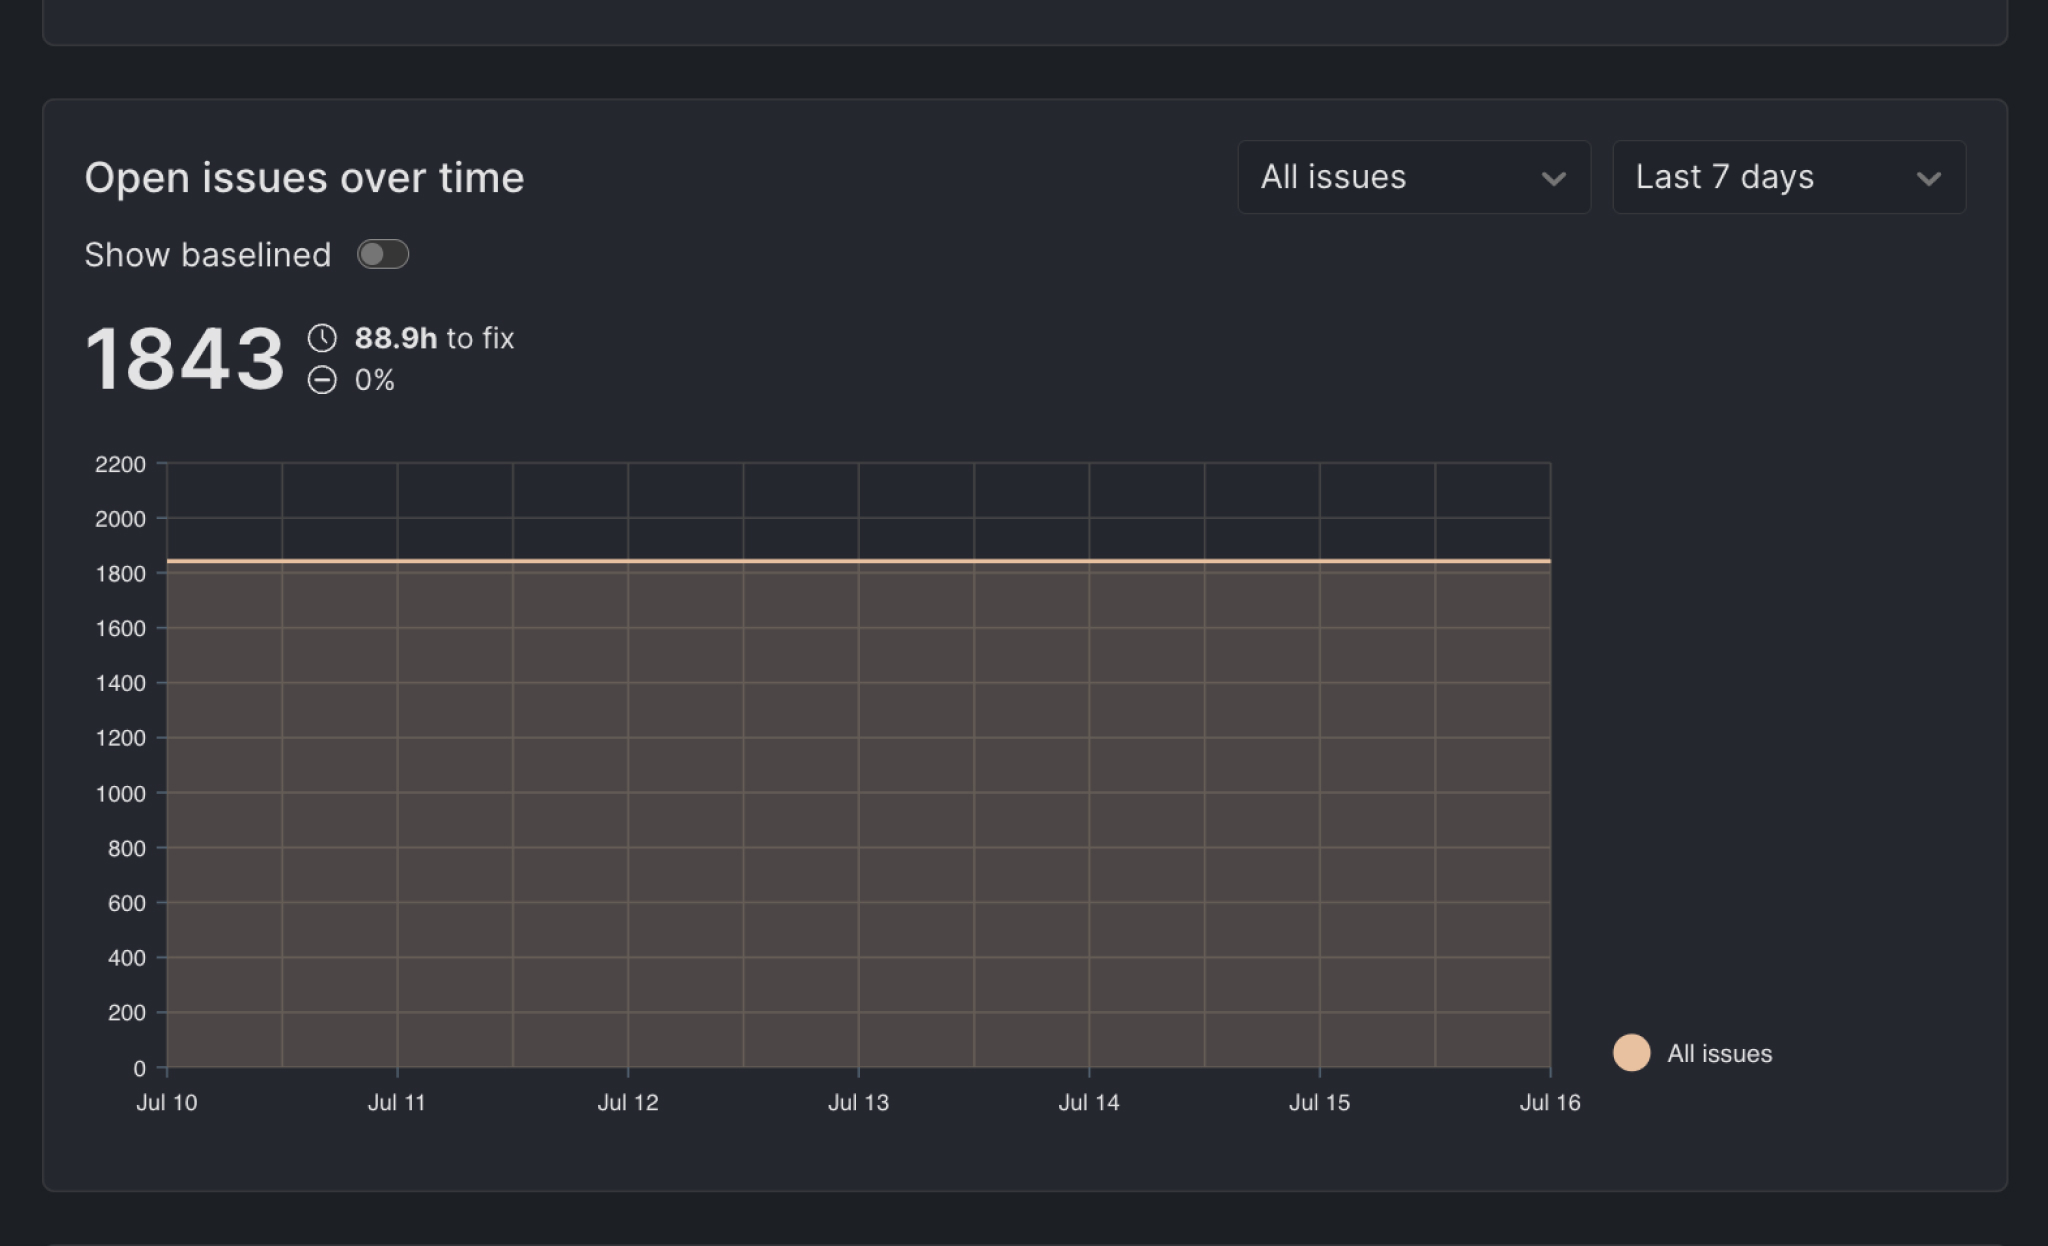
Toggle "Show baselined" to view how the number of baselined issues has changed over time.
Baselined issues over time will not have any data if the project does not have a baseline or the generated baseline has no issues.
To learn more about the baseline, refer to the Baseline documentation.
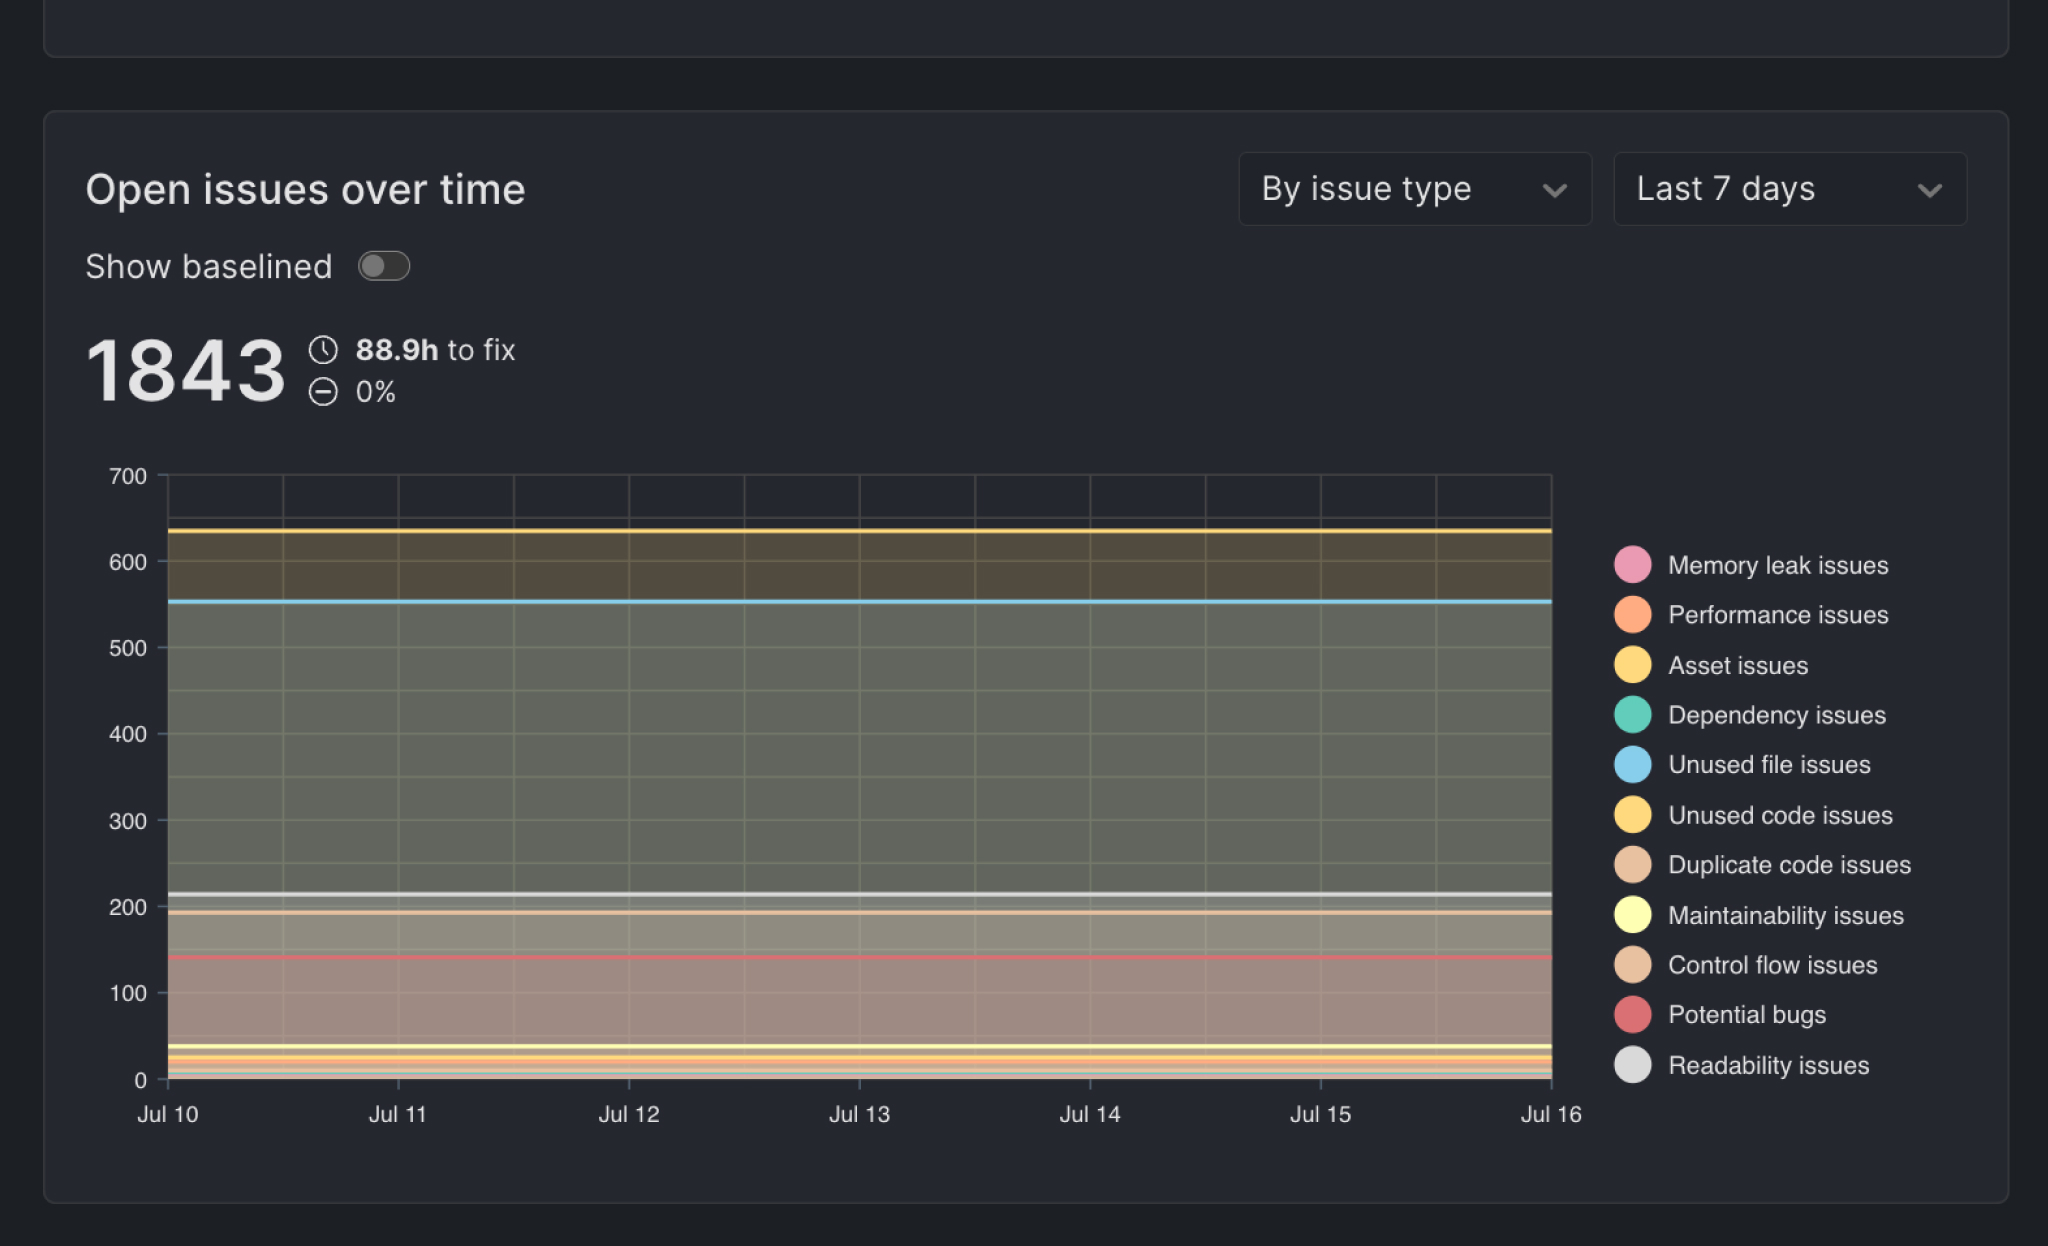
Grouping By Issue Type
By default, the chart shows a single line for all issues and to change the chart to showing a line for each issue category:
- Click on the "All issues" dropdown
- Select the "By issue type" option
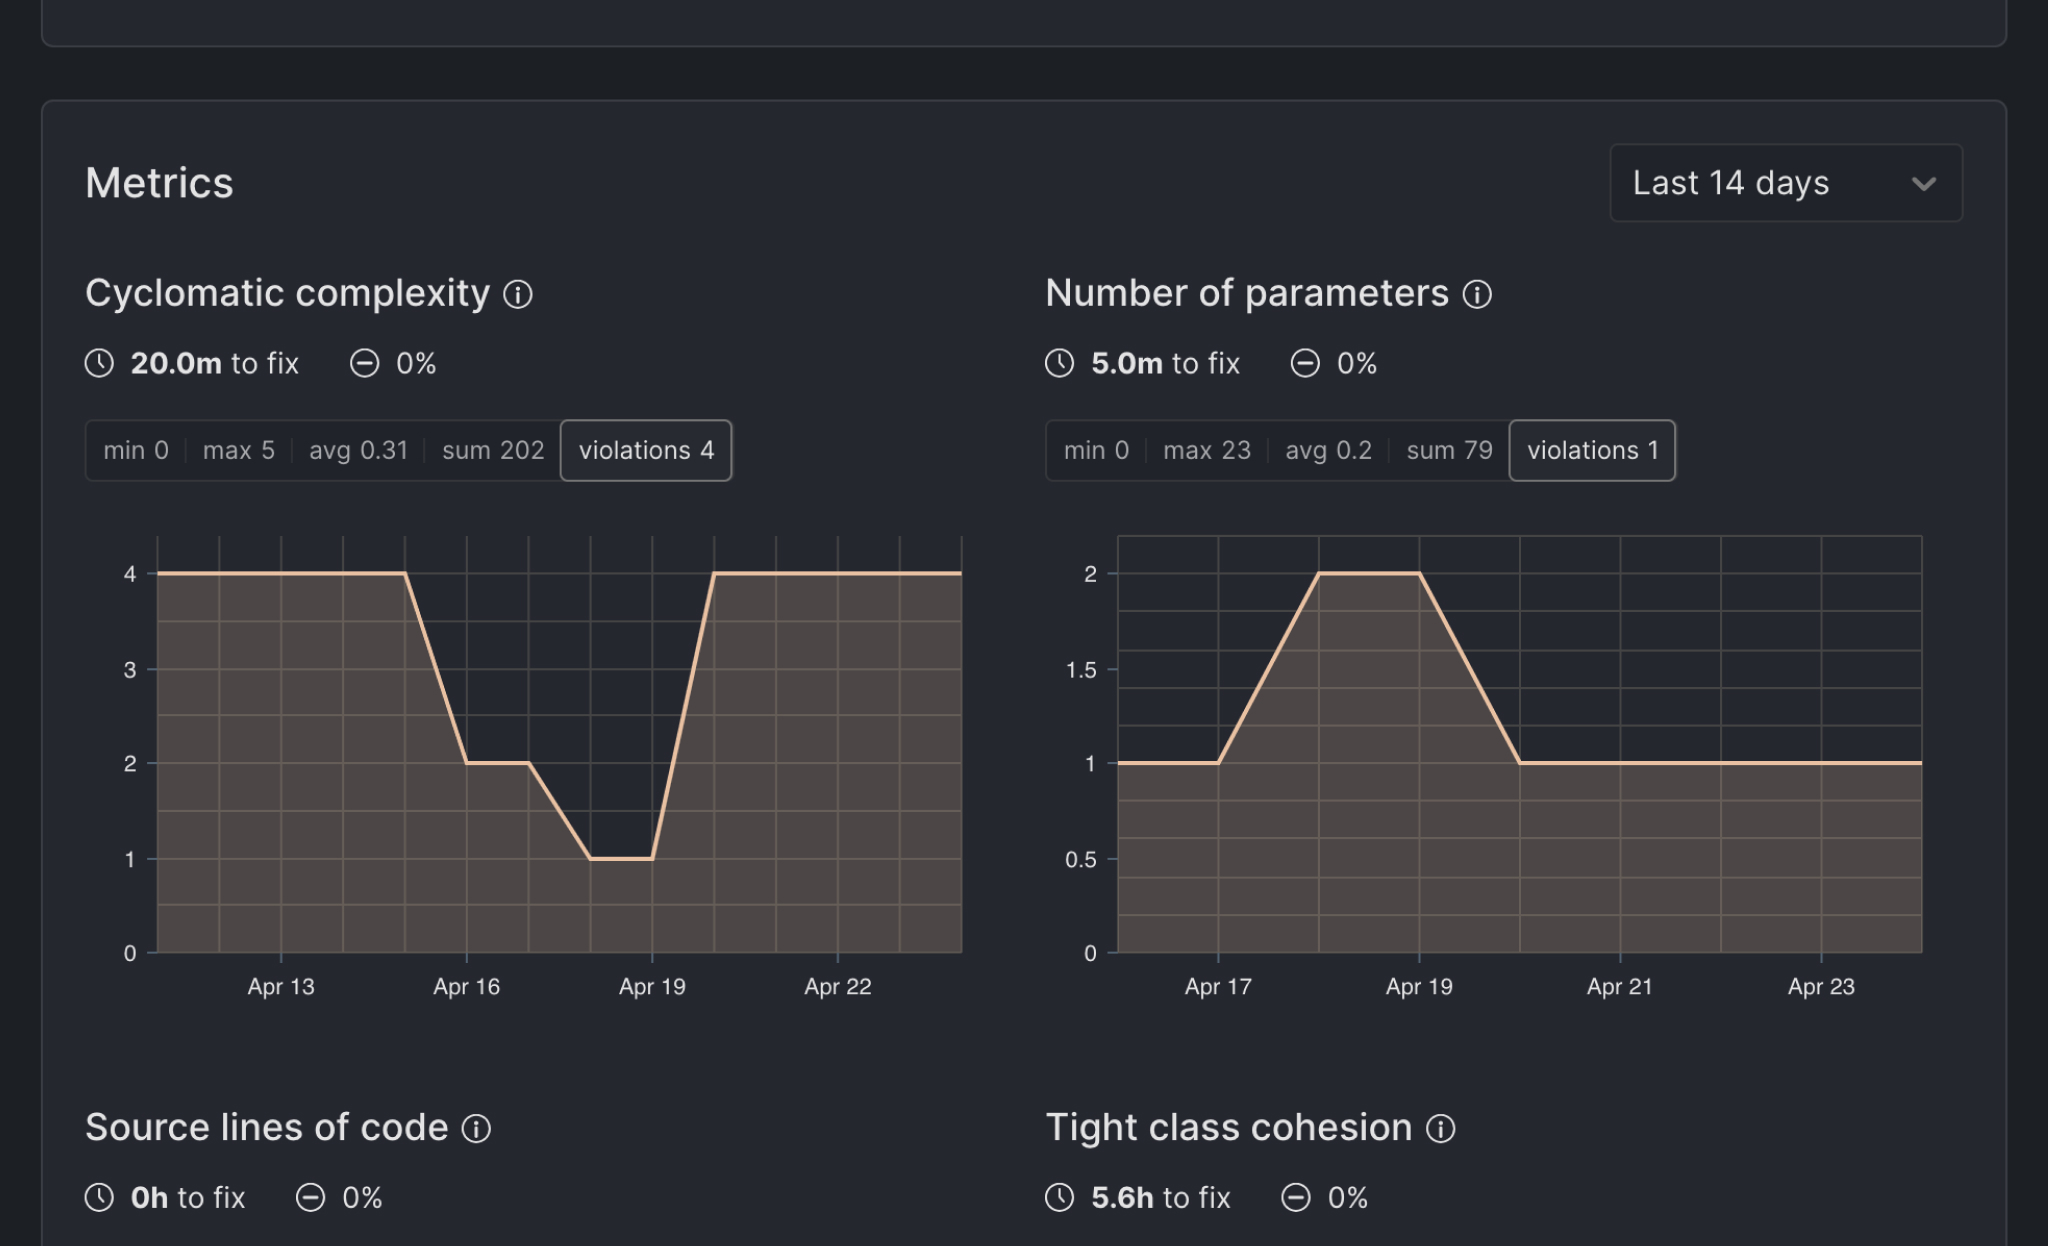
Metrics
This section shows how enabled code quality metrics change over time. Each chart displays:
- Minimum, Maximum, Average, and Sum
- Number of violations (when any metric value goes above the metric's threshold)
- A daily trend line over your selected time range (Last 7, 14, 30, or 90 days)
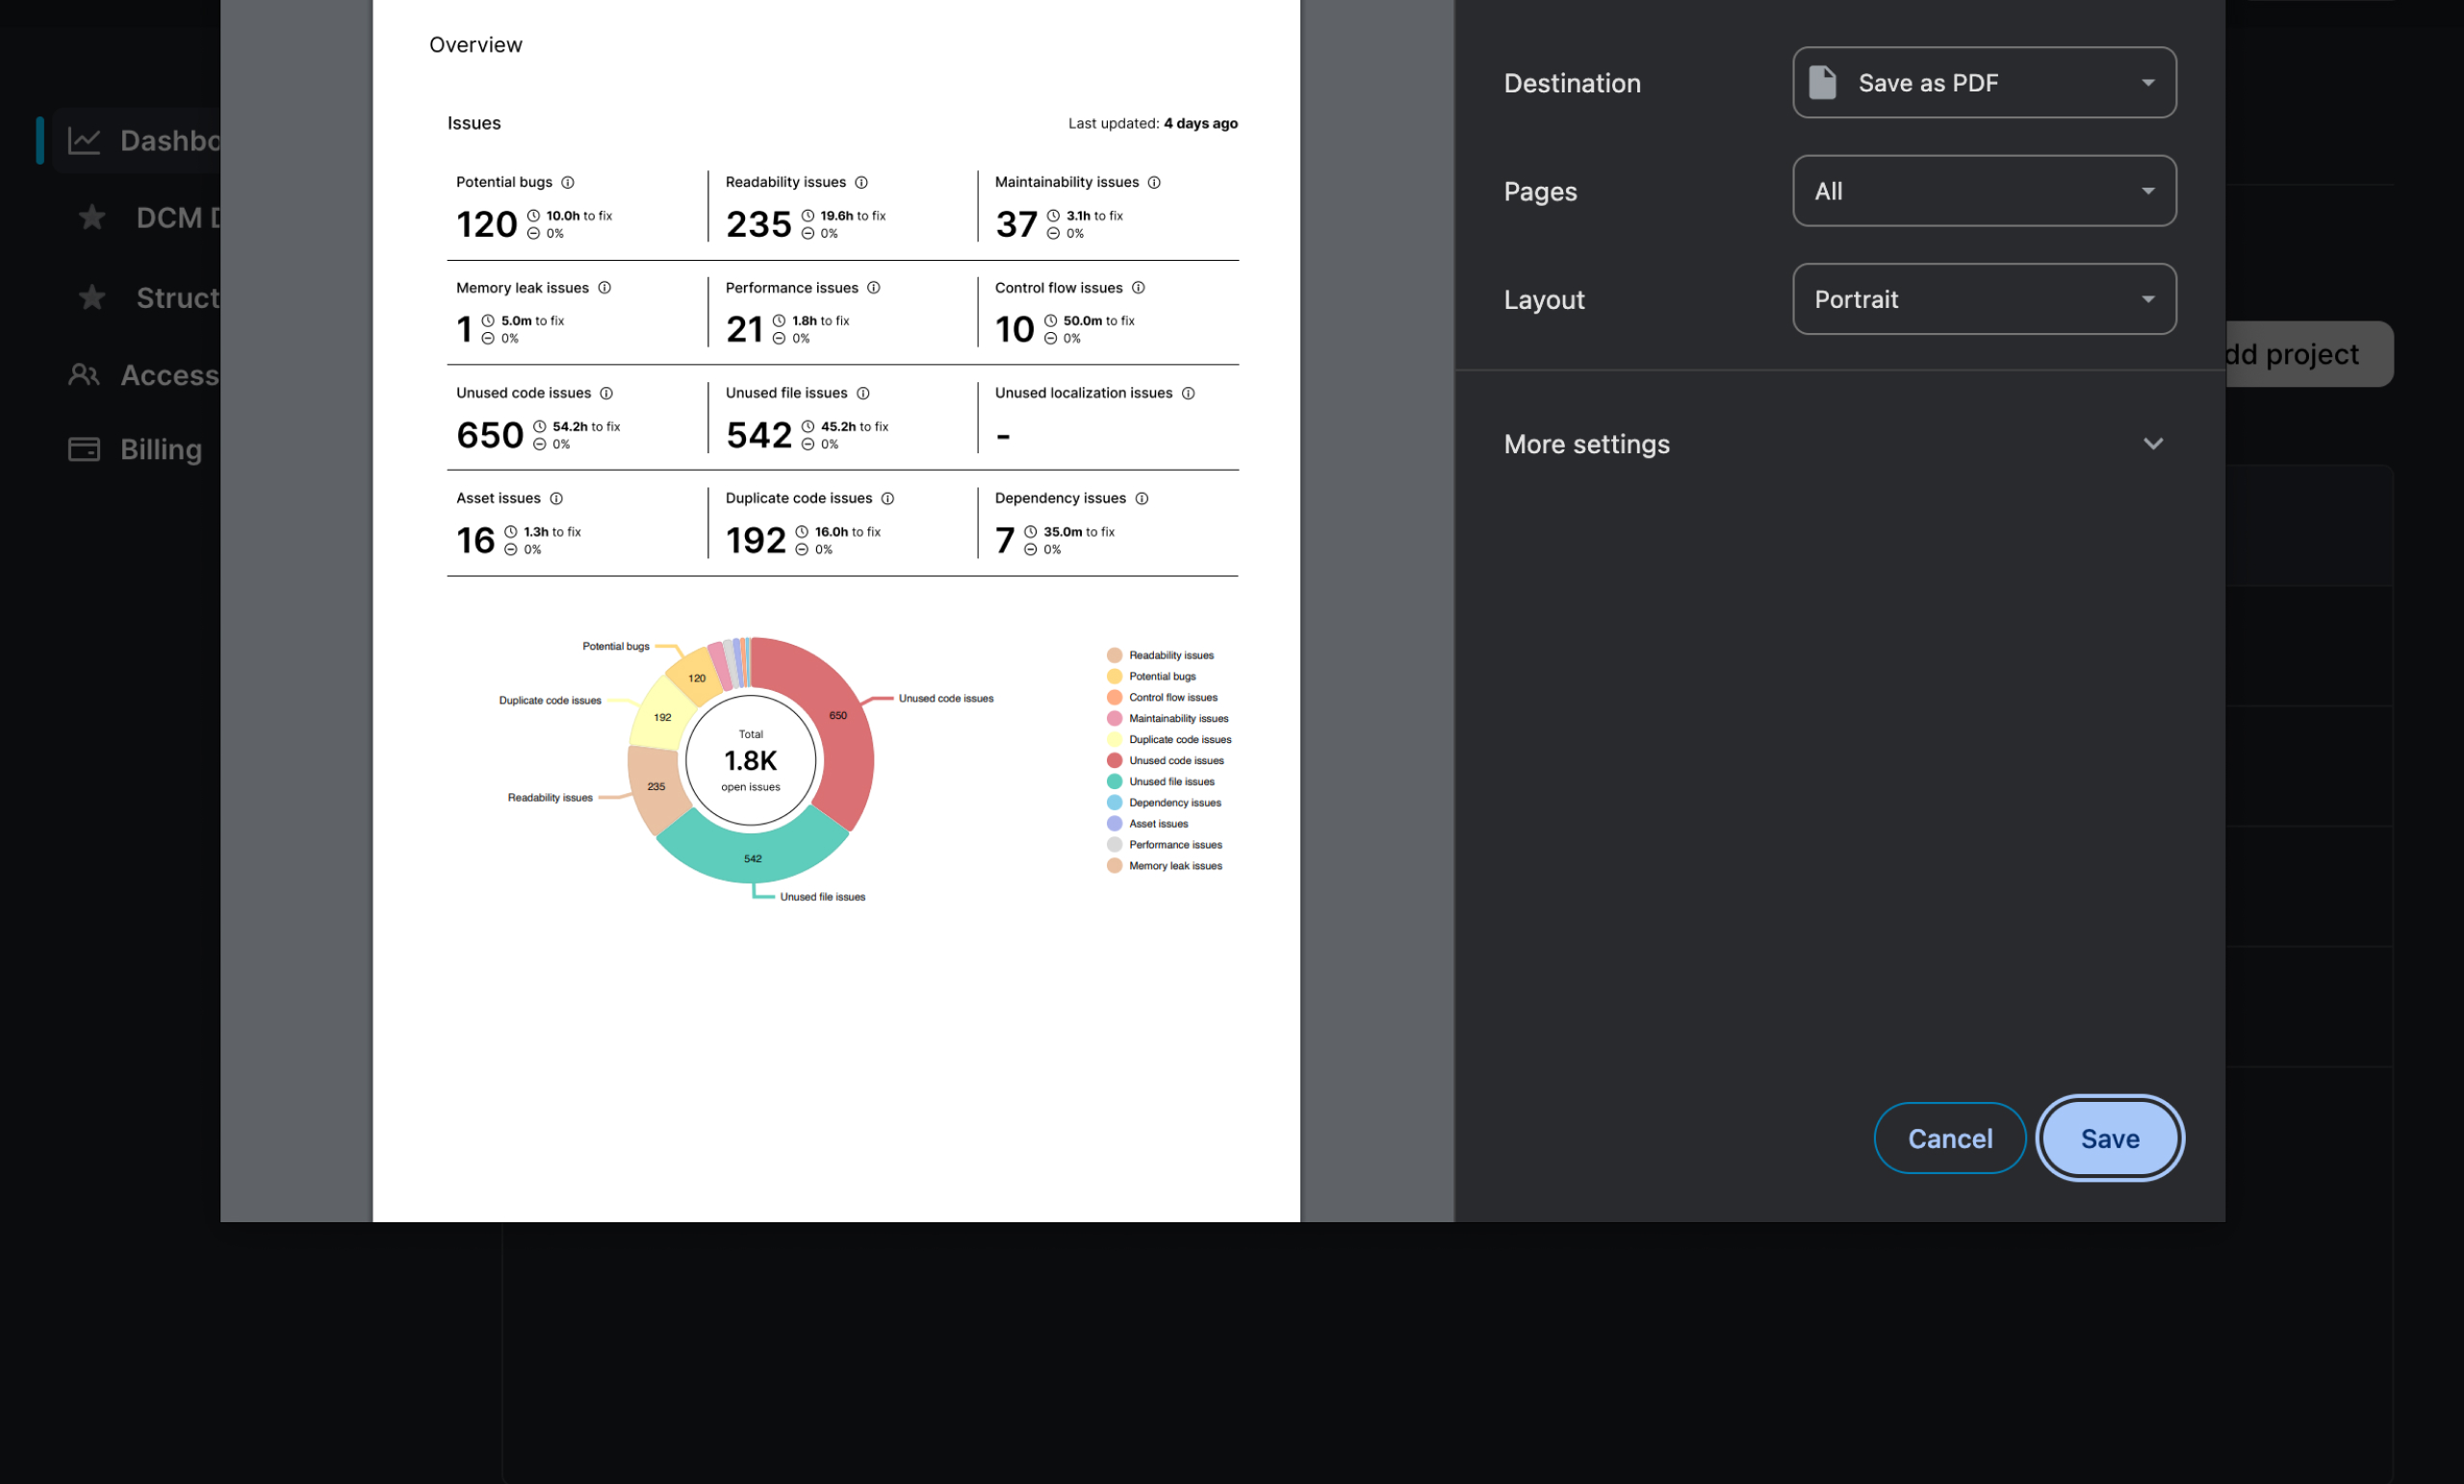
Generating a PDF Report
To generate a PDF report for the Projects Overview page, use the browser ctrl+P/cmd+P menu and save the page as PDF.